


The growth of the economy drives investment returns, and plain and simple, corporate profits—that is, earnings—drive stock prices. Without an understanding of what drives stock prices, investors are often fearful when stock prices plunge or, ironically, when they are breaking record highs. Here’s some help.
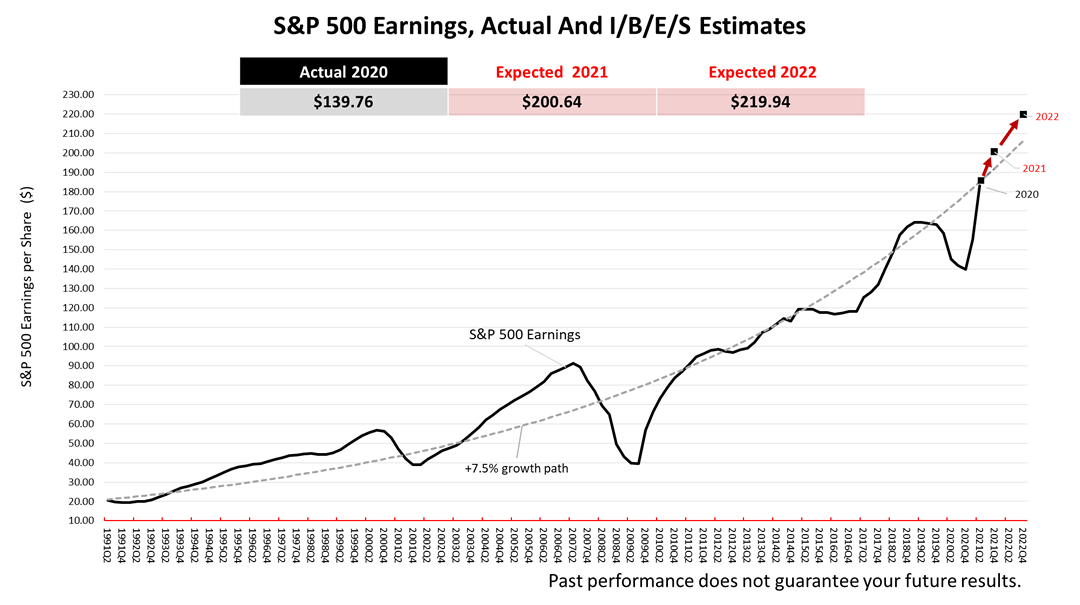
Perhaps the most direct way of connecting the dots between economics and investing is this chart illustrating that what drives stock prices is earnings.
The gray dotted line shows the 7.5% long-term earnings growth trend since 1991. In 2020, actual earnings of the S&P 500 companies were $139.76 per share. Expected earnings in 2021, according to Wall Street analysts’ estimates compiled by Institutional Brokers' Estimate System (IBES), are $200.64 per share and are expected to shoot up to $219.94 for 2022.
The red arrows literally connect the dots to make the forecast clear: The next 20 months’ corporate earnings are expected to rocket much higher.
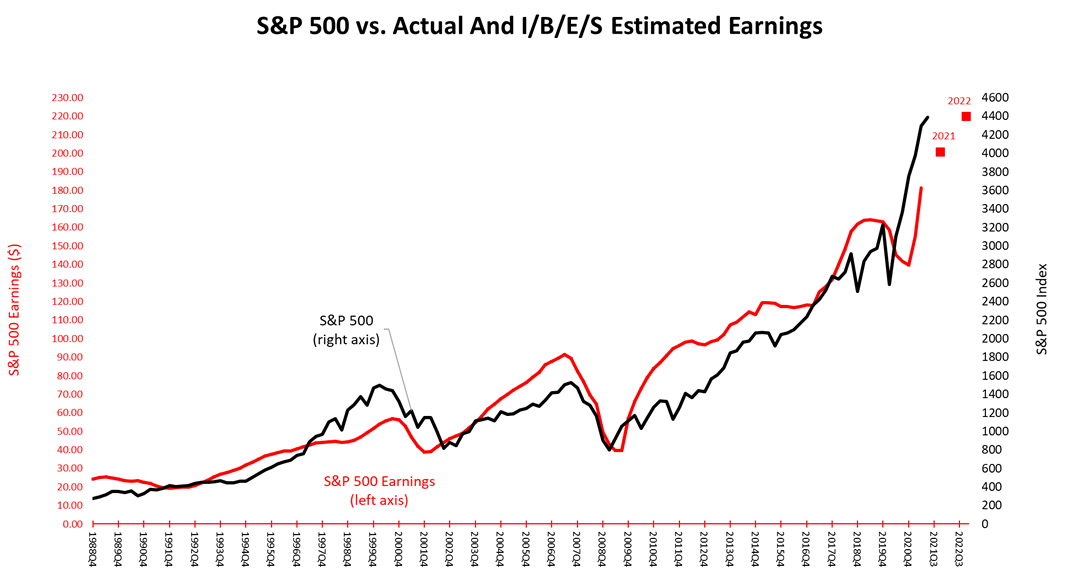
In this chart, to show how earnings drive stock prices, we added the S&P 500 Total Return index, in the black line to the earnings line in red. This shows the nearly perfect correlation between stock prices and earnings since 1989. The 2021 and 2022 earnings forecasts, in the red dots, have pulled the black line higher.
Nothing contained herein is to be considered a solicitation, research material, an investment recommendation, or advice of any kind, and it is subject to change without notice. Any investments or strategies referenced herein do not take into account the investment objectives, financial situation or particular needs of any specific person. Product suitability must be independently determined for each individual investor. Tax advice always depends on your particular personal situation and preferences. You should consult the appropriate financial professional regarding your specific circumstances.
The material represents an assessment of financial, economic and tax law at a specific point in time and is not intended to be a forecast of future events or a guarantee of future results. Forward-looking statements are subject to certain risks and uncertainties. Actual results, performance, or achievements may differ materially from those expressed or implied. Information is based on data gathered from what we believe are reliable sources. It is not guaranteed as to accuracy, does not purport to be complete, and is not intended to be used as a primary basis for investment decisions.
This article was written by a professional financial journalist for Advisor Products and is not intended as legal or investment advice.
This article was written by a professional financial journalist for Advisor Products and is not intended as legal or investment advice.
©2021 Advisor Products Inc. All Rights Reserved.
Eagles' Club in LA, CA for assistance with managing your portfolio.
Eagles' Club
Administration office:
120 Encino Avenue
Camarillo, CA. 93010
Los Angeles Office
10880 Wilshire Blvd. Suite 2222
L.A, CA. 90024
Fax: 818-992-9997
Toll Free: 866-900-AIDA
aida.eaglesclub@adviserfocus.com
Mutual of Omaha Investor Services, Inc. and its representatives do not provide tax or legal advice. Any tax or legal information provided here is merely a summary of our understanding and interpretation of some of the current regulations and is not exhaustive. Tax-law is subject to frequent change; therefore it is important to coordinate with your tax advisor for the latest IRS rulings and specific tax advice, prior to undertaking an investment plan.
Securities offered through Mutual of Omaha Investor Services, Inc. a Registered Broker/Dealer. Member FINRA/SIPC. Advisory services offered through Mutual of Omaha Investor Services, Inc., a SEC Registered Investment Advisory Firm. Eagles' Club and Mutual of Omaha Investor Services, Inc are not affiliated.
Securities, Insurance and Advisory licensed in State of California. California Department of Insurance License Number 0660322. Also Insurance licensed in Kentucky.
![]()
